July 11, 2022 10:30 AM
Transaction flow | New dashboard charts
>>
The Tezos smart contract dashboards have been extended with more charts and a special visualisation showing the flow of transactions between contracts and accounts.
The following charts have been added:
- Contract users
- Contract-generated transactions
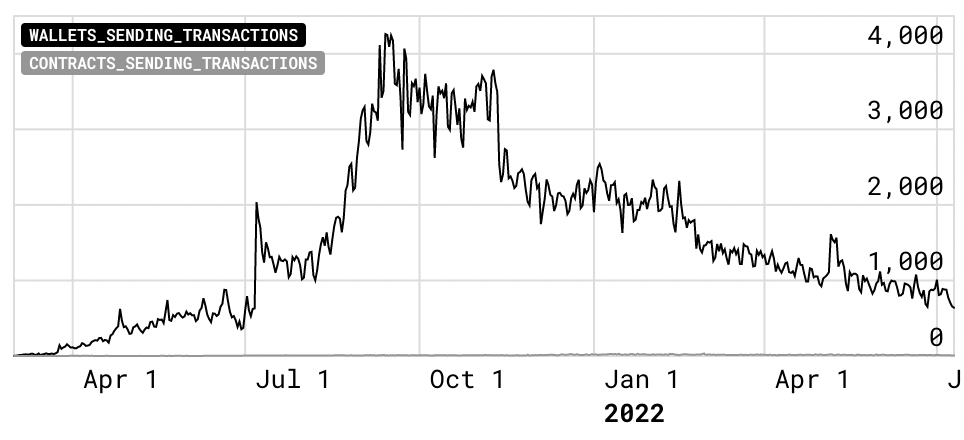
The contract users chart shows the number of unique accounts calling the contract per day, split by wallet account and contract account. These are measured by number of wallets and number of contracts sending transactions to the contract.
The below image shows the chart from the hic et nunc NFT contract used for minting HicEtNunc NFTs, which averaged about 4k wallets at its peak and still has around 1k wallets using it every day.
View the live chart on the HicEtNunc NFTs contract dashboard.
The contract-generated transactions chart shows the transactions produced by the smart contract code when its entrypoints are called.
When a smart contract entrypoint is called through a transaction, the code connected to that entrypoint is executed and can generate new transactions. In many cases these transactions are actually targetting other smart contracts.
The chart shows transactions grouped by targetted contract and entrypoint.
The below image shows the number of transactions generated by the Teia Marketplace contract. When people swap NFTs through the Teia contract, its code actually calls the transfer entrypoint on the HicEtNunc NFTs contract.
View the live chart on the Teia Community Marketplace contract dashboard.
Bringing these two together, we have transactions being created by wallets and other smart contracts coming into the contract on the one side. On the other side new transactions being generated by the contract going to other wallets and contracts.
The Smart Contract dashboards now include a new visual that gives one overview of this combined flow.
Looking again to the Teia Marketplace contract in the picture below, we can see that this contract is initially called by a large number of wallet accounts in the table on the left. The donut chart visualises the distribution of entrypoints being called, which in this case are mainly collect and swap calls with some cancel_swap calls.
The transactions generated by the contract all target the transfer entrypoint on the HicEtNunc NFTs contract.
This is an analysis purely based on the outcome of a smart contracts behaviour, it does not rely on looking at the code itself.
By using the charts and tables in the transaction flow visualisation it is now easy to trace which contracts operate together in networks to provide functionalities such as NFT minting & NFT trading.
Some interesting contracts to take a look at:
This is only the beginning of investigating Tezos transactions and smart contracts as a network. There is much more to come!


